
Bitcoin’s price action in late 2025 has left both seasoned investors and crypto newcomers searching for clarity. As of November 18,2025, Bitcoin (BTC) is trading at $89,415, reflecting a sharp decline from its October peak above $126,000. This nearly 30% drop has erased the year’s gains and reignited the debate about how to navigate the world’s most volatile digital asset.
Bitcoin Slides to $89,415: What’s Fueling the Downturn?
The current slump isn’t just a blip on the radar. Several key forces are converging to push Bitcoin lower:
- Macroeconomic Uncertainty: Global markets are tense as investors react to mixed signals about future U. S. interest rate cuts. The resulting caution is spilling over into crypto markets.
- Institutional Withdrawals: Major players have reduced their exposure to Bitcoin. Over $2.5 billion has exited spot ETFs in recent weeks, intensifying downward pressure and increasing volatility.
- Traditional Market Correlation: Bitcoin is moving more in sync with stocks and bonds than ever before. When risk-off sentiment hits Wall Street, crypto often feels it even harder.
This environment may feel overwhelming for those just starting their crypto journey. But understanding these drivers is key to making informed decisions, especially during turbulent times.
Navigating Crypto Volatility: Lessons for Beginners and Investors
If you’re new to crypto or still building confidence, this price drop can feel like whiplash. Let’s break down what matters most right now:
- Volatility Is Normal: Bitcoin’s dramatic swings are part of its DNA. Price corrections of 20-40% have happened multiple times since its inception, and each time, they’ve tested investor resolve.
- Diversification Matters: A balanced portfolio can help cushion blows from sudden downturns. Allocating only a small percentage to Bitcoin or other cryptocurrencies can enhance returns without putting your entire nest egg at risk.
- Long-Term Perspective Pays Off: While short-term pain grabs headlines, many analysts remain bullish about Bitcoin’s future potential, some even project a return to $200,000 by year-end if institutional flows rebound and regulatory clarity improves.
If you’re looking for deeper insights on how these factors affect first-time buyers, and how leverage shakeouts can create new opportunities, check out our detailed guide at BuyingCryptoToday.
ETF Outflows and Market Sentiment: The Domino Effect
The surge of ETF outflows, over $2.5 billion recently, has been one of the biggest stories shaping Bitcoin’s slide below $90,000. When large funds pull back, it signals caution that ripples through every layer of the market, fueling uncertainty among retail investors as well.
This domino effect is compounded by profit-taking from long-term holders who saw record highs just weeks ago. As these coins hit exchanges, selling pressure increases, and panic can quickly take hold among less experienced holders.
Bitcoin Technical Analysis Chart
Analysis by Maya Callahan | Symbol: BINANCE:BTCUSDT | Interval: 1D | Drawings: 6
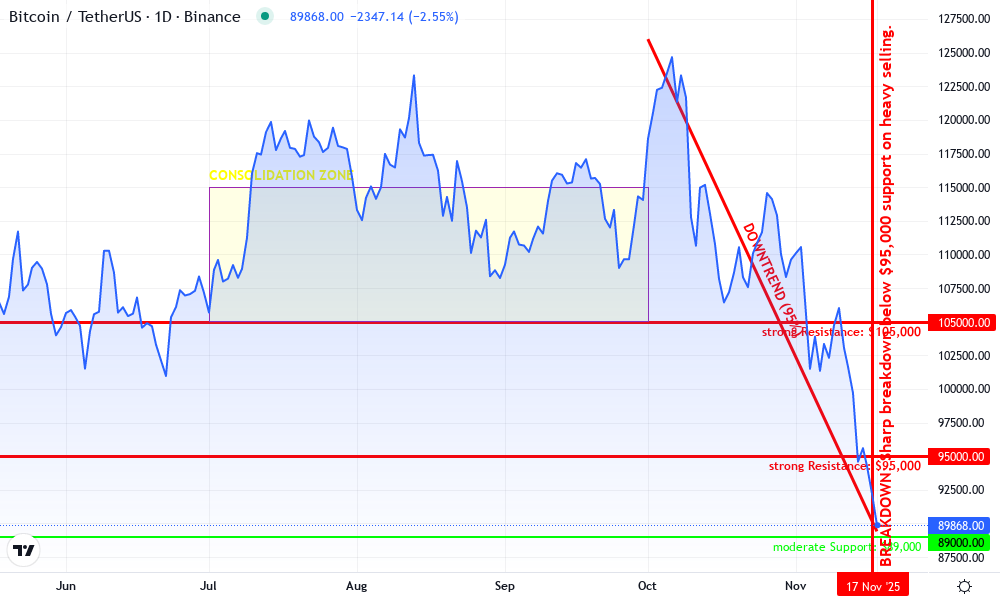
Technical Analysis Summary
Draw a major downtrend line from the October 2025 peak (~$126,000) to the current price near $89,415. Mark horizontal support at $89,000 and $94,000, and resistance at $95,000 and $105,000. Highlight the sharp breakdown in November 2025 with a vertical line. Use a rectangle to show the consolidation zone between $105,000-$115,000 during July to October 2025. Annotate the recent price capitulation with a callout. Indicate potential entry and exit zones based on these levels and patterns.
Risk Assessment:high
Analysis:The decisive breakdown below multi-month support and ongoing macro/institutional headwinds signal elevated risk.Further downside is possible unless price stabilizes above $89 ,000.
Maya Callahan's Recommendation:Maintain caution , avoid leveraged longs , and only initiate small positions at key supports .Consider portfolio diversification and keep stop-losses tight until momentum shifts.
Key Support & Resistance Levels
📈 Support Levels:
- $89 ,000 -Current psychological and round number support ;aligns with recent price action moderate
- $87 ,000 -Potential next support if breakdown continues weak
📉 Resistance Levels:
- $95 ,000 -Recent breakdown level ;likely to act as near-term resistance strong
- $105 ,000 -Major previous support turned resistance ;top of the last consolidation range strong


No comments yet. Be the first to share your thoughts!