
Bitcoin's price sits at $89,181 today, a slight dip that has many newcomers eyeing the market nervously. Yet amid the chatter, BlackRock's iShares Bitcoin Trust (IBIT) ETF has seen a staggering $2.7 billion exodus over five weeks ending November 28,2025, capping the longest outflow streak since its launch. Add in a record single-day redemption of $523.2 million in November, and IBIT's share price at $50.69 reflects the pressure. For crypto beginners, this isn't panic territory; it's the setup for a calculated entry point in 2025.
Decoding BlackRock's IBIT ETF Outflows in 2025
Picture this: the world's largest asset manager, BlackRock, launches a spot Bitcoin ETF that quickly grabs nearly half the market share. Then, investors pull out over $2.7 billion in five straight weeks through late November, with another $113 million vanishing on a single Thursday. Bloomberg and CoinDesk data paint a picture of profit-taking after Bitcoin's rally, as institutions rebalance amid macro uncertainties like interest rate whispers and geopolitical ripples.
IBIT isn't alone in the volatility; it's a symptom of maturing crypto markets where big money flows test resilience. At 48.5% market share, BlackRock's fund dominates, but these outflows highlight investor psychology at play. Beginners often mistake this for collapse, but history shows Bitcoin thrives post-correction. Trading at $89,181, BTC remains robust, down just 0.51% in 24 hours from a high of $90,171.

Why ETF Redemptions Spell Opportunity at $89,181
For those new to crypto, ETF outflows like IBIT's can feel alarming, but they often clear weak hands, paving the way for stronger legs up. Think of it as a market cleanse: overleveraged positions unwind, prices stabilize around $89,181, and fresh capital waits on the sidelines. BlackRock's ETF, despite the bleed, still holds massive assets under management, underscoring sustained interest in Bitcoin as a portfolio diversifier.
I've seen this pattern across assets over a decade - stocks, commodities, now crypto. The $2.7 billion exit mirrors 2022's shakeout, followed by Bitcoin's climb past $60,000. Today's dip, with IBIT at $50.69, offers beginners a low-risk on-ramp via regulated ETFs, sidestepping wallet hassles. No FOMO required; balance dictates buying when sentiment sours.
Navigating the Dip: Beginner Strategies Amid IBIT Pressure
Start simple: dollar-cost average into spot Bitcoin ETFs during these outflows. BlackRock's dominance means IBIT tracks BTC closely, so as Bitcoin holds $89,181, you're betting on fundamentals like halvings and adoption, not hype. Avoid timing the bottom; instead, assess your risk - perhaps 1-5% portfolio allocation for starters.
Key signals? ETF flows often lag retail enthusiasm. This IBIT exodus coincides with BTC's consolidation near $89,000, a level technicals view as support. Pair it with macro tailwinds like potential rate cuts, and 2025 looks primed for rebound. Beginners, this is your cue to learn, not flee.
Bitcoin (BTC) Price Prediction 2026-2031
Annual forecasts post-IBIT $2.7B outflows and $89,181 stabilization (Bear, Base, Bull cases)
| Year | Minimum Price (Bear Case) | Average Price (Base Case) | Maximum Price (Bull Case) |
|---|---|---|---|
| 2026 | $70,000 | $105,000 | $140,000 |
| 2027 | $85,000 | $130,000 | $180,000 |
| 2028 | $110,000 | $165,000 | $230,000 |
| 2029 | $140,000 | $210,000 | $300,000 |
| 2030 | $180,000 | $270,000 | $380,000 |
| 2031 | $220,000 | $340,000 | $480,000 |
Price Prediction Summary
Despite $2.7B IBIT outflows signaling short-term correction, Bitcoin's stabilization at $89,181 in 2025 presents a prime buying opportunity. Projections anticipate recovery in 2026, accelerating post-2028 halving with base case reaching $340K by 2031, driven by institutional adoption and market cycles.
Key Factors Affecting Bitcoin Price
- Resumption of ETF inflows post-correction
- 2028 Bitcoin halving catalyzing bull cycle
- Regulatory advancements and global adoption
- Macroeconomic shifts favoring risk assets
- Technological upgrades enhancing scalability
- Historical market cycle resilience after outflows
Disclaimer: Cryptocurrency price predictions are speculative and based on current market analysis. Actual prices may vary significantly due to market volatility, regulatory changes, and other factors. Always do your own research before making investment decisions.
While those projections paint an optimistic path forward, the real story blending with IBIT's $2.7 billion outflows is BlackRock's recent $125 million Bitcoin transfer. Reports suggest this move shuttled BTC to secure custody, a quiet vote of confidence from the asset giant even as ETF redemptions peaked. Institutions don't shift nine-figure sums lightly; it's accumulation disguised amid the noise, signaling long-term conviction when retail frets at $89,181.
The Institutional Dance: Outflows Meet Strategic Transfers
Contrast the exodus with this transfer: investors cash out short-term gains from Bitcoin's run-up, yet BlackRock repositions holdings for efficiency. At IBIT's $50.69 share price, down 3.45% recently, the ETF mirrors BTC's 0.51% 24-hour dip from $90,171. This duality - panic sells versus strategic holds - creates asymmetry for beginners. Weak capital exits, leaving room for patient entries. Over my years tracking hybrids like this, such divergences precede rallies; think 2021's ETF hype turning into 2024's institutional flood.
Macro layers add fuel. With Bitcoin consolidating above $88,966 lows, ETF flows reveal psychology more than fundamentals. Halving cycles, ETF approvals, and nation-state buys persist underneath. For newcomers, ignore the headlines screaming 'bleed'; focus on net inflows across all spot ETFs, where IBIT's dominance at 48.5% market share endures despite the streak.
Bitcoin Technical Analysis Chart
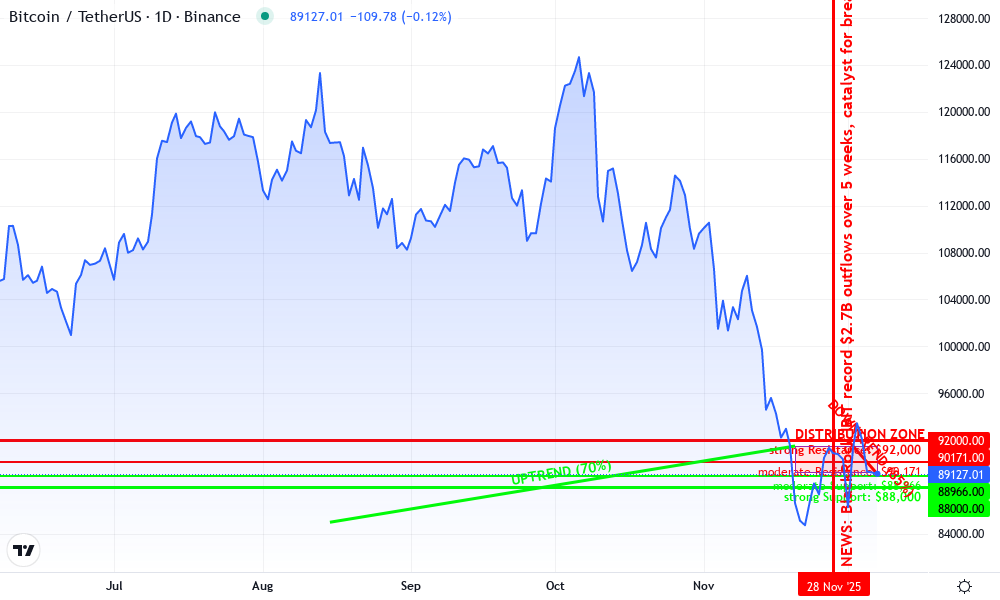
Analysis by Maya Callahan | Symbol: BINANCE:BTCUSDT | Interval: 1D | Drawings: 8
Technical Analysis Summary
In my balanced hybrid style, start by drawing a short-term downtrend line connecting the peak at 2025-12-01 around $92,000 to the current low near $89,181 on 2025-12-07, using 'trend_line' with red color to highlight the recent selling pressure amid ETF outflows. Add horizontal_lines at key support $88,966 (recent 24h low, moderate) and $89,000 (psychological), and resistance at $90,171 (24h high) and $92,000 (prior peak, strong). Use 'rectangle' for the distribution range from late Nov to now. Mark MACD bearish signal with 'arrow_mark_down' near Dec 5. Vertical_line at 2025-11-28 for ETF news. Fib_retracement from recent high to low for potential bounce levels. Callouts for volume decline and entry zones. This setup educates on balanced risk amid macro caution.
Risk Assessment: medium
Analysis: Technical downtrend with supports holding near $89k, but macro ETF outflows add uncertainty; BTC history favors bounces, yet volatility high.
Maya Callahan's Recommendation: Scale in longs on support confirmation with tight stops—balance caution with opportunity.
Key Support & Resistance Levels
📈 Support Levels:
- $88,966 - Recent 24h low and initial support test post-drop. moderate
- $88,000 - Psychological level and prior consolidation low, strong historical hold. strong
📉 Resistance Levels:
- $90,171 - 24h high, immediate overhead resistance. moderate
- $92,000 - Recent peak coinciding with ETF outflow peak. strong
Trading Zones (medium risk tolerance)
🎯 Entry Zones:
- $89,000 - Bounce from cluster support near current price $89,181, low volume suggests exhaustion. medium risk
- $88,500 - Deeper support test for higher conviction long, aligned with medium risk tolerance. high risk
🚪 Exit Zones:
- $91,000 - Profit target at resistance confluence. 💰 profit target
- $88,200 - Stop loss below strong support. 🛡️ stop loss
Technical Indicators Analysis
📊 Volume Analysis:
Pattern: Declining volume on downside move
Bearish but low conviction selloff, potential exhaustion signal.
📈 MACD Analysis:
Signal: Bearish crossover below zero line
Momentum turning negative, confirming downtrend but watch for divergence.
Applied TradingView Drawing Utilities
This chart analysis utilizes the following professional drawing tools:
Disclaimer: This technical analysis by Maya Callahan is for educational purposes only and should not be considered as financial advice. Trading involves risk, and you should always do your own research before making investment decisions. Past performance does not guarantee future results. The analysis reflects the author's personal methodology and risk tolerance (medium).
Navigating this as a beginner means embracing volatility as feature, not bug. Dollar-cost averaging sidesteps the guesswork of bottoms, turning $89,181 into your average entry over time. Pair it with a 1-5% allocation rule, diversified across stables or stocks, aligning with my balance mantra.
Your Action Plan: Safe Entry During the IBIT Dip
DCA into IBIT Safely: Turn $2.7B Outflows into Your 2025 Bitcoin Buying Opportunity


Examples abound of smart plays in chaos. Texas recently deployed $5 million into BlackRock's BTC ETF amid these outflows, a blueprint for conservative exposure via regulated vehicles. Beginners can replicate safely through familiar brokers, avoiding direct custody pitfalls like lost keys. This beginner guide to spot Bitcoin ETFs echoes that prudence, emphasizing verification over velocity.
Technical supports bolster the case: Bitcoin's 24-hour range hugs $89,000, with historical bounces from similar ETF stress. My view? This IBIT exodus prunes the tree for 2025 growth, especially if rate relief materializes. Stay measured - no all-ins, just consistent buys when others bail.
Risk tolerance varies, but data favors resilience. Bitcoin's post-correction surges - from 2022 lows to $90,000 highs - reward those who dollar-cost through dips. BlackRock's moves, outflows included, affirm crypto's evolution into mainstream allocation. At $89,181, with IBIT at $50.69, position incrementally. Balance isn't timing the market; it's thriving through it. Your portfolio's growth starts with this informed step.


No comments yet. Be the first to share your thoughts!