
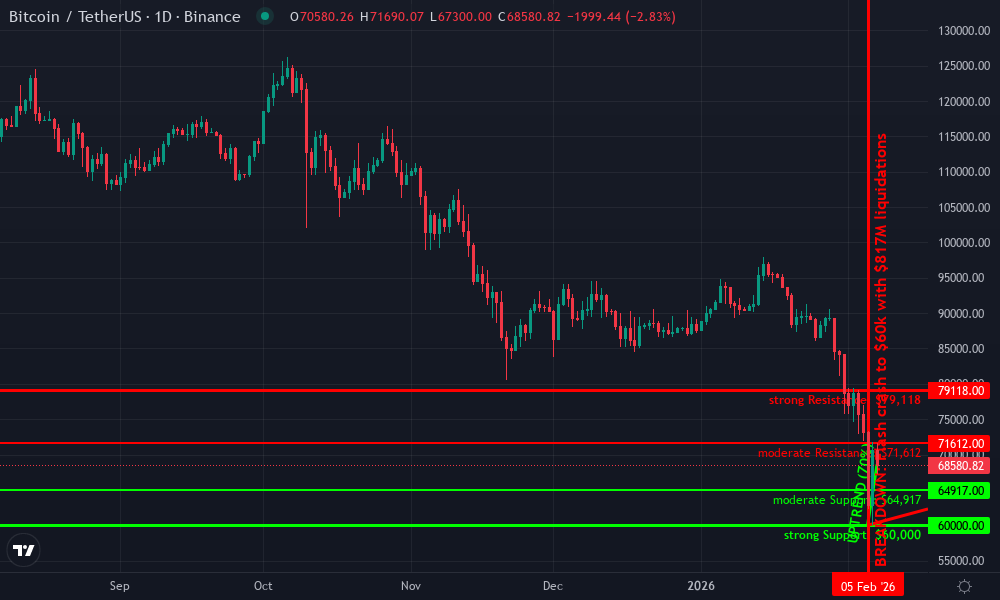
Bitcoin's brutal plunge to $60,000 on February 5,2026, sent shockwaves through the crypto world, wiping out over $817 million in positions and plunging the Crypto Fear and amp; Greed Index to a chilling score of 9. As of February 7, the price has rebounded to $68,606.00, up 5.68% in the last 24 hours with a high of $71,612.00 and low of $64,917.00. This volatility underscores a historic selloff from October's $126,000 peak, yet it presents a rare window for disciplined new buyers. Panic dominates headlines, but seasoned investors recognize extreme fear as a contrarian signal. If you're eyeing this bitcoin crash 2026 as an entry point, onboarding demands precision to sidestep leverage traps and scams.
Unpacking the Chaos: Leverage Flushes and Miner Pressure Behind the $60K Low
Heavy selling across global markets collided with aggressive leverage unwinds, driving Bitcoin to its weakest level since late 2024. Coinglass data reveals $817 million liquidated in four hours, hitting longs hardest as overleveraged traders got margin-called. Miners, facing profitability squeezes, offloaded holdings amid broader fears of a crypto winter. The so-called "Kevin Warsh effect"-tied to hawkish Fed commentary-amplified the rout, sparking a $2 trillion market cap evaporation. Yet, stablecoin minting activity hinted at underlying demand, preventing a deeper breakdown. Bitcoin's quick bounce from $60,000 to $71,500 signals buyers lurking, not fleeing. For context, weekly lows hit $62,353.54 on February 5 before this recovery to $68,606.00. Newcomers must grasp these mechanics: crashes like this prune weak hands, resetting the market for stronger foundations.
Behavioral Edge in Extreme Fear: Why a Greed Index of 9 Screams Opportunity
The Fear and amp; Greed Index at 9 isn't just a number; it's a psychological barometer flashing capitulation. Historically, such readings precede rebounds-think March 2020's COVID crash or 2022's bear bottom. Traders refused to catch falling knives at $60,000, but data shows smart money accumulating. Reddit's r/BitcoinMarkets buzzed with technical setups favoring upside, while YouTube analysts like Ricky Gutierrez urged patience before buying 2026 dips. This 50% drawdown from peaks mirrors past cycles, where post-panic rallies delivered outsized gains. As a 20-year veteran, I've seen stocks and bonds behave similarly: fear overshoots fundamentals. Bitcoin's network fundamentals-hash rate stability, ETF inflows-remain intact despite the noise. For buy bitcoin dip 2026 strategies, tune out social media hysteria; focus on dollar-cost averaging into strength.
Bitcoin (BTC) Price Prediction 2027-2032
Post-February 2026 $60K Crash Recovery Projections | Current Price (Feb 7, 2026): $68,606 | Assumed 2026 Year-End Avg: $110,000
| Year | Minimum Price | Average Price | Maximum Price | YoY % Change (Avg from Prior) |
|---|---|---|---|---|
| 2027 | $100,000 | $150,000 | $220,000 | +36% |
| 2028 | $130,000 | $210,000 | $350,000 | +40% |
| 2029 | $200,000 | $400,000 | $700,000 | +90% |
| 2030 | $250,000 | $350,000 | $550,000 | -12% |
| 2031 | $280,000 | $450,000 | $750,000 | +29% |
| 2032 | $400,000 | $650,000 | $1,200,000 | +44% |
Price Prediction Summary
Bitcoin is forecasted to recover strongly from the 2026 crash, reaching a base $110K by year-end 2026. Projections for 2027-2032 show cyclical growth peaking in 2029 post-2028 halving, with base average prices climbing to $650K by 2032. Bearish mins reflect potential corrections, while bullish maxes capture adoption-driven surges amid historical patterns.
Key Factors Affecting Bitcoin Price
- 2028 and 2032 Bitcoin halvings driving supply shocks and bull cycles
- Rising institutional adoption via ETFs and corporate treasuries
- Regulatory clarity and global mainstream integration
- Technological advancements in scalability (e.g., Layer 2 solutions)
- Macroeconomic tailwinds like potential rate cuts and inflation hedging
- Post-crash miner capitulation reducing sell pressure
- Historical 4-year cycle recoveries from extreme fear levels (Fear & Greed Index at 9)
Disclaimer: Cryptocurrency price predictions are speculative and based on current market analysis. Actual prices may vary significantly due to market volatility, regulatory changes, and other factors. Always do your own research before making investment decisions.
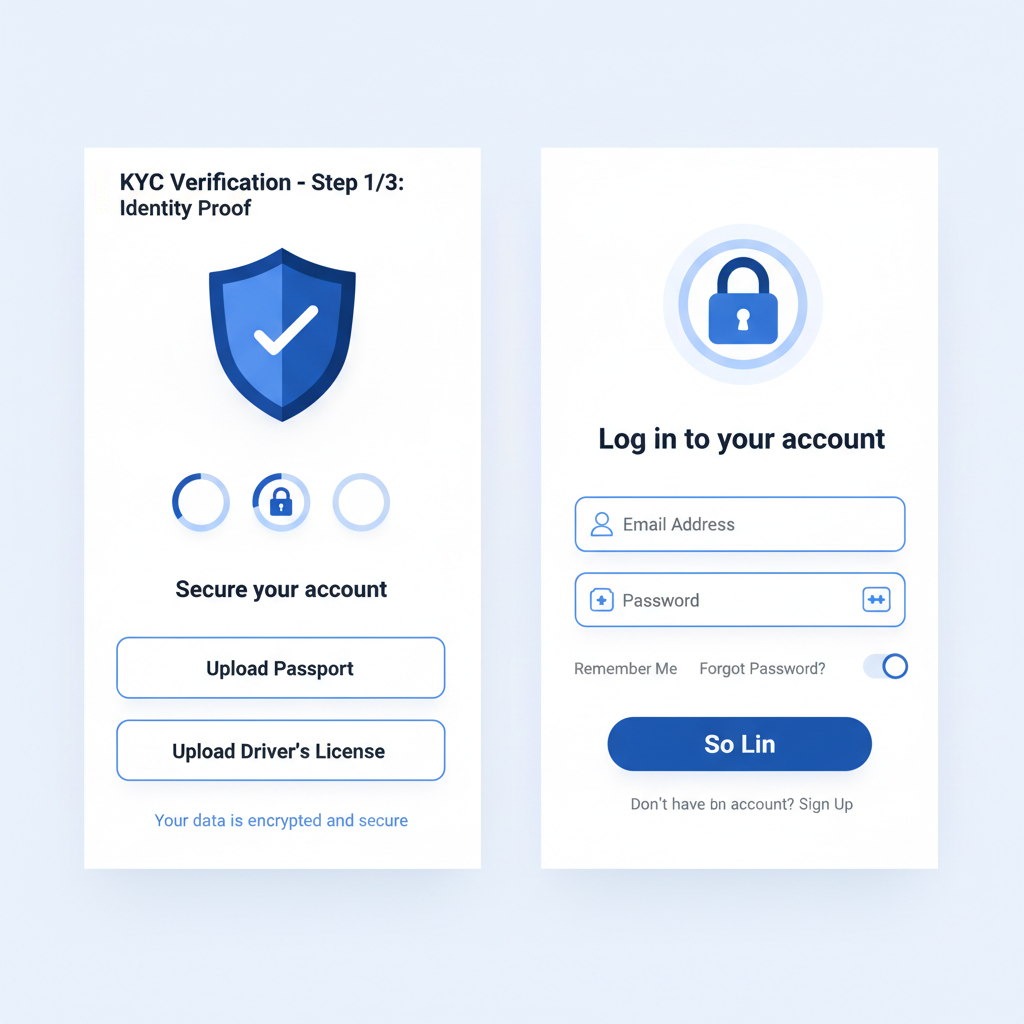
Safe Onboarding Essentials: First Steps for New Buyers Amid Volatility
Diving into Bitcoin during a crash requires a fortress mindset. Start with self-custody: avoid exchanges holding your keys long-term. Use reputable wallets like hardware devices for bitcoin onboarding guide basics. Verify KYC on tier-1 platforms-Coinbase, Kraken-only; steer clear of unverified apps promising quick riches. During extreme fear, scams proliferate: crypto ATM scams surge, luring panic sellers with fake high yields. Always double-check addresses; one typo and funds vanish. Allocate no more than 5% of your portfolio initially, scaling in as fear subsides. Track on-chain metrics-miner outflows easing, whale accumulation-to time entries. This methodical approach transforms a selloff into your advantage.
Knowledge is the best hedge: In crashes, preparation trumps prediction.
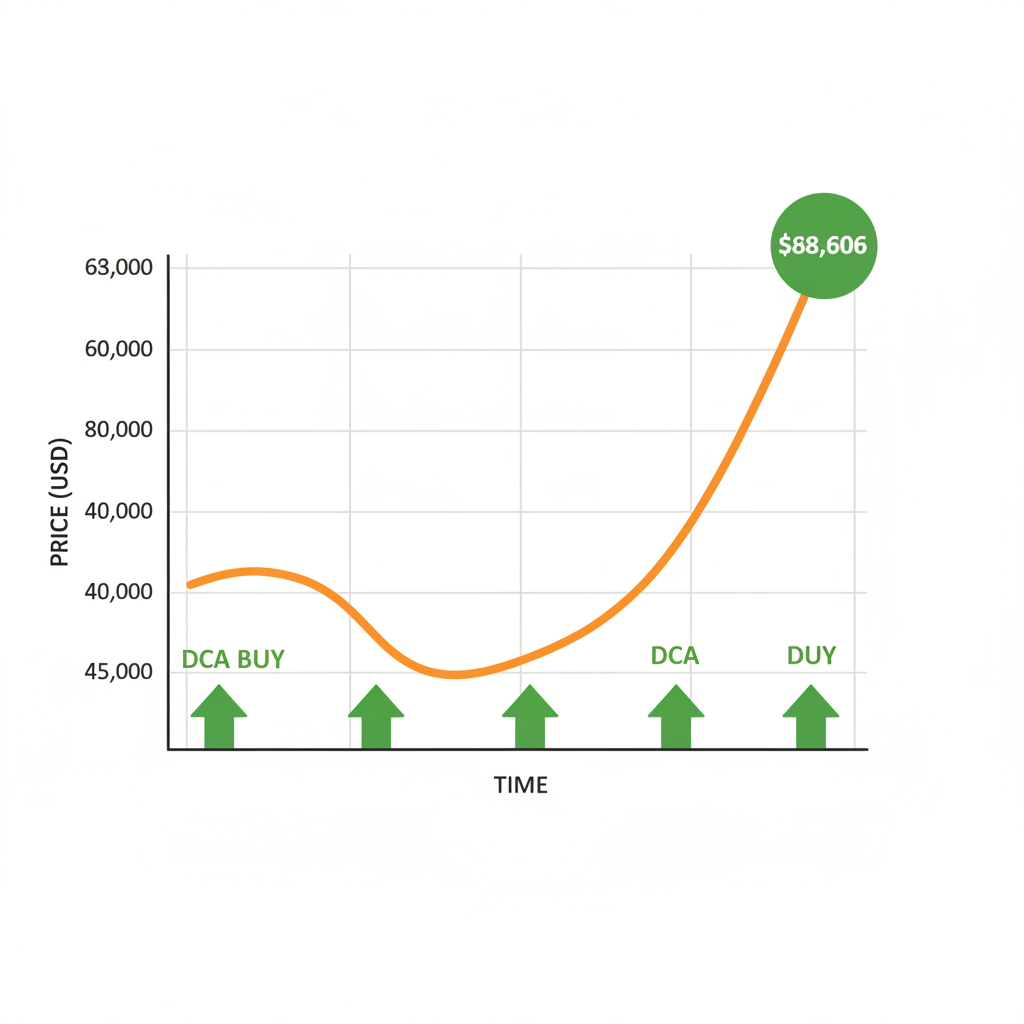
Even as Bitcoin holds at $68,606.00, with that 5.68% 24-hour gain signaling tentative buyer resolve, onboarding newcomers face a gauntlet of emotional traps and operational hurdles. Dollar-cost averaging emerges as your anchor: invest fixed amounts weekly, regardless of price swings from $64,917.00 lows to $71,612.00 highs. This prunes the guesswork from buy bitcoin dip 2026 plays, averaging your cost basis toward cycle lows. I've managed portfolios through three crypto winters; DCA turns chaos into compounding velocity, capturing rebounds without chasing peaks.
Precision Entry Protocol: Step-by-Step Onboarding at $68,606 Amid Crash Aftermath
Skip the hype; build systematically. First, audit your risk tolerance-no more than 2-5% portfolio exposure initially, scaling as the Fear and Greed Index climbs past 25. Select custodians with proven uptime: tier-1 exchanges for fiat ramps, then immediate wallet transfers. Monitor on-chain flows; easing miner sells and rising stablecoin reserves foreshadow strength. Volatility spikes like this week's $62,353.54 bottom reward patience, not FOMO. Integrate technical levels-support at $64,917.00 held firm-offer confluence for entries. This isn't gambling; it's engineered accumulation.
Secure Bitcoin Onboarding: Buy Safely at $68,606 During 2026 Extreme Fear Crash
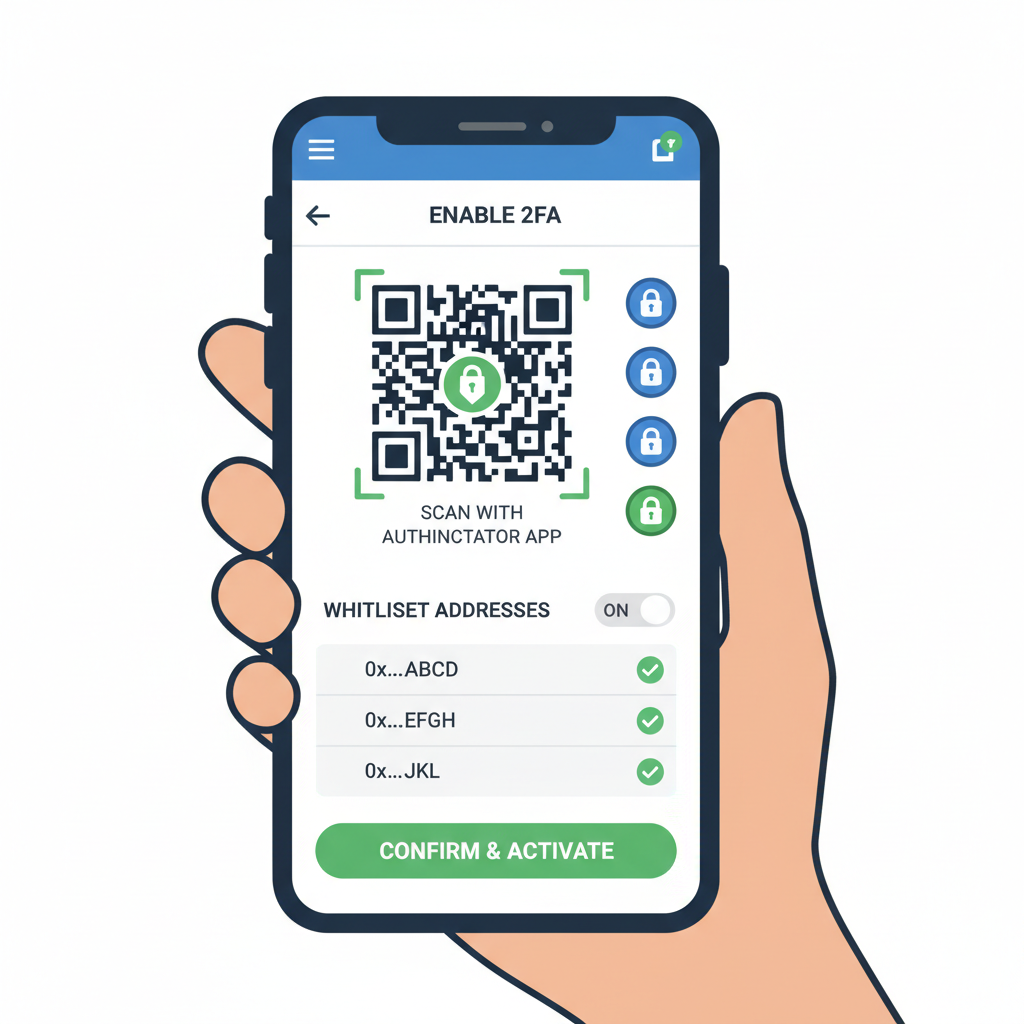
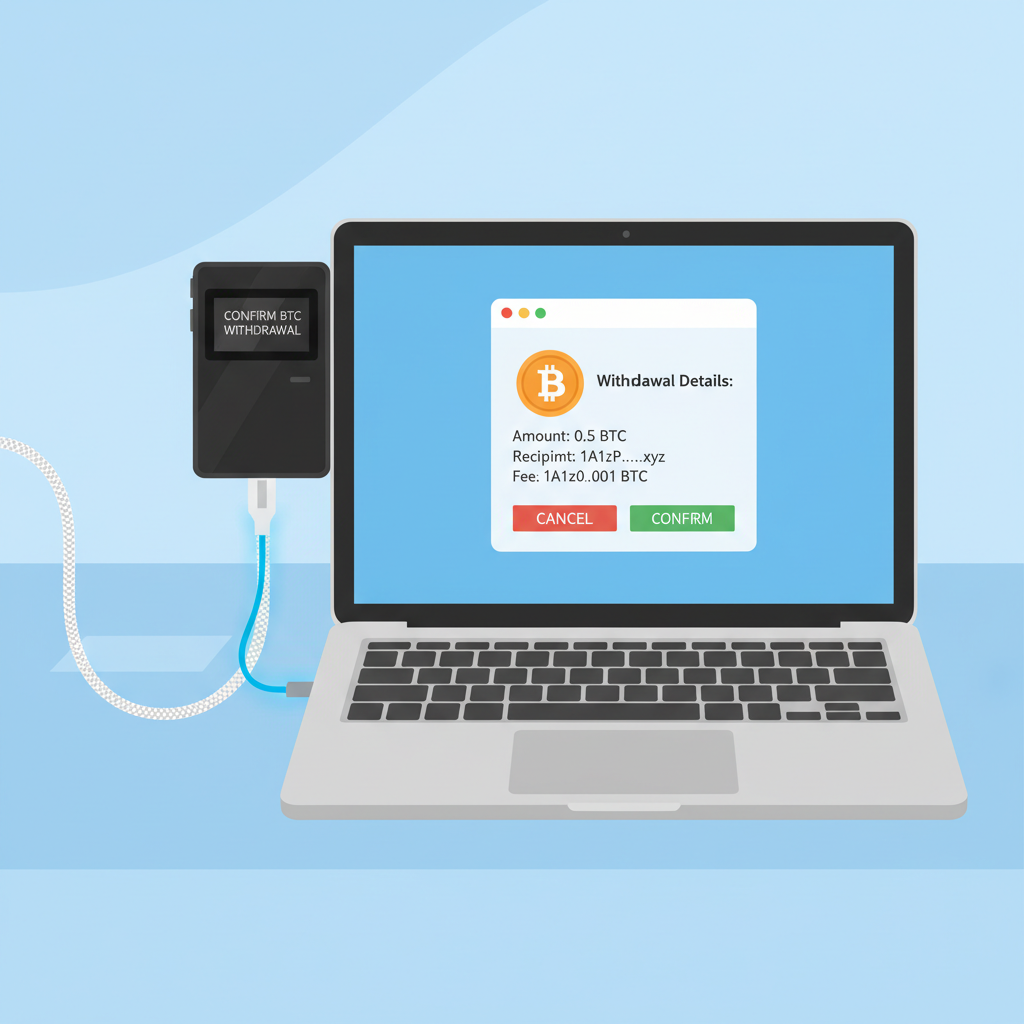
Security forms the bedrock. Phishing peaks in fear phases; never click unsolicited DMs or QR codes. Hardware wallets shield against exchange hacks, enforcing the golden rule: not your keys, not your coins. Shun peer-to-peer deals absent escrow, and especially crypto ATM scams avoid tactics, where machines skim fees or swap bogus receipts. Test small transactions first-$50 buys confirm rails work. As ETF inflows persist despite the rout, institutional ballast supports your retail stack. Opinion: crashes cull speculators, elevating Bitcoin's scarcity narrative for patient holders.
Bitcoin Technical Analysis Chart
Analysis by Market Analyst | Symbol: BINANCE:BTCUSDT | Interval: 1D | Drawings: 7
Technical Analysis Summary
Draw a prominent downtrend line from the December 2025 peak near $120,000 (2025-12-15T00:00:00Z at 120000) connecting to the February 5 low at $60,000 (2026-02-05T00:00:00Z at 60000), now showing signs of breakage with recent bounce. Add horizontal support at $64,917 (24h low) and $60,000 (flash crash low), resistance at $71,612 (24h high). Use fib retracement from Oct peak $126k to Feb low $60k, highlighting 38.2% at ~$86k. Mark volume spike on crash with arrow down. Place entry zone long above $68,600 with PT $71,600 SL $64,900. Add text callouts for 'Extreme Fear Bottom' at Feb 5 low and 'Buyer Absorption' on bounce.
Risk Assessment: medium
Analysis: High volatility post-crash, but V-recovery and extreme fear suggest bottoming; medium tolerance fits scaling in
Market Analyst's Recommendation: Buy dips to 65k support, target 71-79k, hold core position for rebound
Key Support & Resistance Levels
📈 Support Levels:
- $64,917 - 24h low, initial bounce point moderate
- $60,000 - Flash crash bottom, extreme fear level strong
📉 Resistance Levels:
- $71,612 - 24h high, immediate overhead supply moderate
- $79,118 - Weekly high pre-crash, key retest level strong
Trading Zones (medium risk tolerance)
🎯 Entry Zones:
- $68,606 - Break above current price on volume confirms bounce continuation medium risk
🚪 Exit Zones:
- $71,612 - 24h high resistance test 💰 profit target
- $64,917 - Break of 24h low invalidates bounce 🛡️ stop loss
Technical Indicators Analysis
📊 Volume Analysis:
Pattern: Spike on downside capitulation, then declining on recovery
Massive red volume bar on Feb 5 crash ($817M liqs), now green bars with lower volume indicating exhaustion
📈 MACD Analysis:
Signal: Bullish divergence forming
MACD histogram contracting after deep negative, line crossing signal from below amid price bounce
Applied TradingView Drawing Utilities
This chart analysis utilizes the following professional drawing tools:
Disclaimer: This technical analysis by Market Analyst is for educational purposes only and should not be considered as financial advice. Trading involves risk, and you should always do your own research before making investment decisions. Past performance does not guarantee future results. The analysis reflects the author's personal methodology and risk tolerance (medium).
Risk Calibration: Sizing Positions and Exit Rules Post-$60K Panic
Position sizing demands math, not bravado. At $68,606.00, a $10,000 allocation buys roughly 0.146 BTC; project forward with halving cycles and adoption curves for 3-5x upside by 2028. Set tiered exits: 20% at $80,000, trail stops thereafter. Diversify anchors-20% BTC in a 60/40 stock-bond mix historically weathers drawdowns. Behavioral pitfalls abound: social media echo chambers amplify 'death spiral' fears, yet hash rate resilience and corporate treasuries contradict doom. Track volatility via realized price bands; breaches signal deeper corrections, but $64,917.00 defense held. My FRM lens: hedge with stablecoin collars if leverage tempts, though spot-only suits most.
For safe buy btc during crash, layer in macro overlays. Fed pivot whispers could propel past $100,000, but miner capitulation resolves first. Reddit threads dissect setups favoring $75,000 tests soon. Long-term, this $60K flush resets leverage, priming explosive upside akin to 2021's post-$30K surge. New buyers: embrace the fear, execute flawlessly, and let time arbitrage the panic.
Discipline forges fortunes in the forge of fear.


No comments yet. Be the first to share your thoughts!