

Bitcoin just cratered to a 24-hour low of $76,686 before clawing back to $78,771, down 6.13% or $5,141 in the last day. This brutal slide from yesterday’s $84,011 peak stems from massive U. S. spot Bitcoin ETF outflows totaling $817 million on January 30, with BlackRock’s IBIT alone dumping $317.8 million. Layer on Kevin Warsh’s nomination as next Fed Chair, and you’ve got markets pricing in hawkish policy that could squeeze liquidity from risk assets like crypto. As a day trader who’s ridden six years of these swings, I see panic selling creating prime entry points, but only if you play it smart.

Volatility like this isn’t new in 2026’s bitcoin dip. Institutional money fleeing ETFs has eroded the support that kept BTC above $80,000, pushing it below that psychological level. Yet history shows these ETF flow reversals often spark rebounds, especially when macro fears overplay their hand.
ETF Outflows Exposed: $1.6 Billion Red Ink Signals Short-Term Pain
Spot Bitcoin ETFs bled $1.49 billion in their final January week, ballooning monthly outflows to $1.6 billion – the third-worst on record. BlackRock’s flagship fund led the charge with heavy redemptions, stripping buying pressure that propped up $90,000 and levels. This isn’t retail panic; it’s big money reallocating amid uncertainty. Check the details on recent ETF trends here. For beginners, this means thinner order books and sharper drops, but also fat discounts on BTC if you time it right.

Outflows coincide with broader risk-off moves. Yahoo Finance notes BTC hit $81,045 – its weakest since November – before stabilizing near $84,000 pre-drop. TradingView pegs the current rut at $77,800 levels, underscoring how ETF flows dictate near-term momentum. My take: react fast to these exits, but don’t chase the bottom blindly. Scale in as volume dries up.
Kevin Warsh Fed Nod Ignites Hawkish Bitcoin Fears
Kevin Warsh’s nomination as Fed Chair has traders bracing for tighter policy. Known for advocating reduced money printing, Warsh could hike rates or unwind balance sheets faster, hammering high-beta assets like Bitcoin. Reuters reports the speculation alone slumped BTC to two-month lows, while CCN ties the crash below $80,000 directly to this news. CryptoSlate flips the script slightly, hinting Warsh might foster Bitcoin-friendly rules long-term via better liquidity tracking and SEC access. Short-term, though? It’s spooked institutions into sell mode.
Forbes warns of a potential 40% plunge wiping $1 trillion from crypto, but I call BS on doomsday calls. Bitcoin’s held near $84,000 post-news in some sessions, per Economic Times, showing resilience. As your guide through this bitcoin dip 2026, focus on price action over headlines: support at $76,686 held, and RSI oversold screams bounce potential.
Bitcoin (BTC) Price Prediction 2027-2032
Forecasts amid 2026 ETF outflows, hawkish Fed policy under Kevin Warsh, and long-term halving/adoption cycles (2026 annual avg. baseline: $85,000)
| Year | Min ($) | Avg ($) | Max ($) | Est. YoY Growth % |
|---|---|---|---|---|
| 2027 | $65,000 | $110,000 | $160,000 | +29% |
| 2028 | $120,000 | $250,000 | $450,000 | +127% |
| 2029 | $200,000 | $400,000 | $700,000 | +60% |
| 2030 | $300,000 | $600,000 | $1,000,000 | +50% |
| 2031 | $450,000 | $850,000 | $1,400,000 | +42% |
| 2032 | $650,000 | $1,200,000 | $1,900,000 | +41% |
Price Prediction Summary
Despite 2026 pressures from $1.6B+ ETF outflows and Kevin Warsh’s hawkish nomination driving BTC below $78K, recovery is expected in 2027 with bull acceleration post-2028 halving. Average prices projected to surge 13x to $1.2M by 2032, balancing bearish macro chokepoints against adoption, scarcity, and regulatory tailwinds.
Key Factors Affecting Bitcoin Price
- Hawkish Fed policy (Warsh) causing short-term dips but resilience via BTC’s store-of-value narrative
- ETF flow reversal as institutions re-enter post-volatility
- 2028 halving catalyzing multi-year bull cycle
- Institutional/sovereign accumulation boosting demand
- Regulatory clarity on ETFs, stablecoins, and market access
- Macro liquidity rebound and rate cuts post-2027
- Network upgrades (e.g., scalability) enhancing utility vs. competition
Disclaimer: Cryptocurrency price predictions are speculative and based on current market analysis.
Actual prices may vary significantly due to market volatility, regulatory changes, and other factors.
Always do your own research before making investment decisions.
Spotting the Buy Signal in This $78,771 Dip
Dips like this – fueled by buy bitcoin etf outflows and kevin warsh fed chair crypto buzz – test your nerves. But for beginners eyeing a safe crypto purchase during dip, here’s the pragmatic edge: volatility creates asymmetry. BTC’s 24-hour range from $84,011 to $76,686 mirrors classic exhaustion patterns I’ve traded profitably. Watch for ETF inflow flips; even marginal reversals ignite 10-20% pumps.
Investopedia highlights how big buys haven’t lifted prices yet, but that’s the cue. Binance updates flag institutional outflows as the dump trigger, yet stablecoin inflows persist as a stealth bull signal. My day-trading lens: enter on confirmed higher lows above $78,771, trail stops tight at 2-3% risk. No hero trades – dollar-cost average into strength.
Stablecoin accumulation hints at smart money positioning for the rebound. With BTC pinned at $78,771, this bitcoin dip 2026 screams opportunity for disciplined entries. But beginners, hear me: rushing in without a plan torches accounts. Let’s break down the bitcoin buying guide beginners need right now.
Your Bulletproof Checklist for Safe Crypto Purchases During Dips
Tick those boxes, and you’re armored against the chaos. First, pick regulated exchanges like Coinbase or Kraken – no shady offshore spots. Fund with fiat via bank transfer to dodge high fees. Then, dollar-cost average: split your buy into 3-5 tranches, starting small above the $76,686 low. Set stops at 3% below entry to cap downside. I’ve day-traded these patterns for years; this setup turns volatility into edge.
Why now? ETF outflows create temporary discounts, but history proves reversals. BlackRock’s IBIT redemptions hurt, yet inflows often follow panic. Learn more on navigating buy bitcoin etf outflows in this guide: BlackRock ETF outflows impact. Pair that with on-chain metrics: rising exchange reserves signal bottoms.
Master Price Action: Key Levels to Watch Above $78,771
React fast to breakouts. Resistance lurks at yesterday’s $84,011 high; a close above flips bullish. Support holds at $76,686 – breach that, and $70,000 tests next, but oversold stochastics say unlikely. My pragmatic call: scale in on volume spikes with MACD crossovers. Trail profits at 5-10% gains; never let winners reverse.
For kevin warsh fed chair crypto risks, hedge 20% in stablecoins. Warsh’s hawkish bent pressures liquidity, but Bitcoin’s scarcity shines in tight money eras. CryptoSlate nails it: track ETF flows and stablecoin supply as leading indicators. Binance data shows outflows easing; that’s your green light.
Bitcoin Technical Analysis Chart
Analysis by Owen Sutherland | Symbol: BINANCE:BTCUSDT | Interval: 1D | Drawings: 6
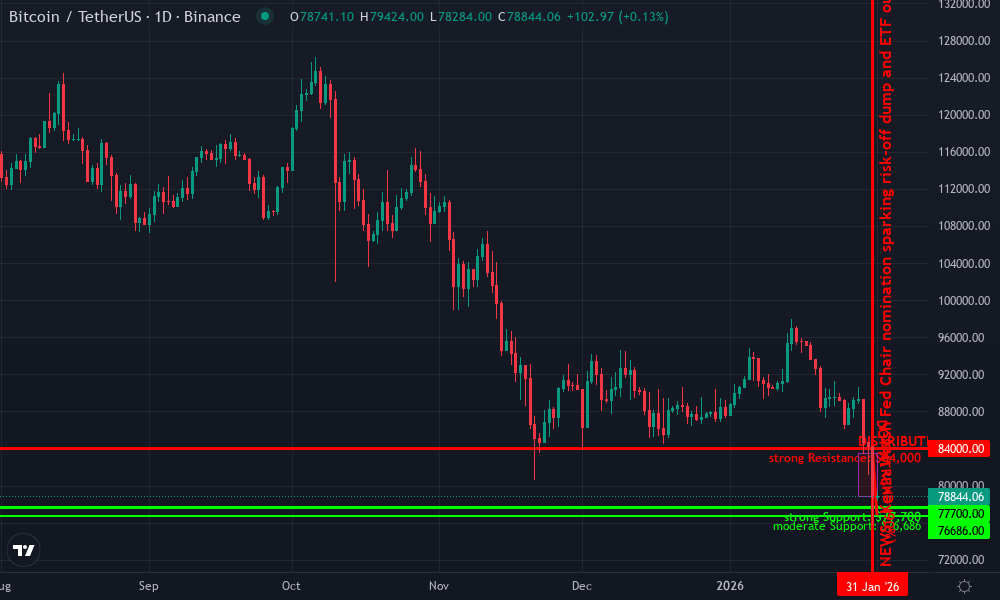
Technical Analysis Summary
To illustrate this bearish breakdown on the BTCUSDT daily chart, start by drawing a steep downtrend line connecting the swing high at 2026-01-31 around $84,011 to the current low at 2026-02-01 near $76,686, highlighting the aggressive selling pressure. Add horizontal lines at key support $77,700 (recent lows) and resistance $84,000 (24h high). Use Fibonacci retracement from the recent peak to low for potential pullback zones at 38.2% ($79,500) and 50% ($80,350). Mark volume spikes with downward arrows on the downside moves. Place a vertical line on 2026-01-31 for the Warsh nomination news catalyst. Finally, rectangle the distribution range from late January highs to early February lows for clarity on the topping pattern.
Risk Assessment: high
Analysis: Elevated volatility from macro news and record ETF redemptions; current price $78,771 teetering on support amid 6%+ daily drop—medium tolerance warrants caution
Owen Sutherland’s Recommendation: Stand aside or light short bias until $80k reclaim; prioritize patience over FOMO in this rut.
Key Support & Resistance Levels
📈 Support Levels:
-
$77,700 – Cluster of recent lows and psychological round number holding the dump
strong -
$76,686 – 24h low, potential further breakdown zone
moderate
📉 Resistance Levels:
-
$84,000 – 24h high and prior session close, key overhead barrier
strong -
$82,000 – Intermediate pullback resistance from fib 23.6%
weak
Trading Zones (medium risk tolerance)
🎯 Entry Zones:
-
$78,500 – Bounce from strong support at $77,700 with volume divergence, aligning medium risk swing long
medium risk -
$80,000 – Break and close above resistance for bullish confirmation
low risk
🚪 Exit Zones:
-
$82,000 – Profit target at minor resistance/fib level
💰 profit target -
$77,500 – Stop loss below key support to limit downside
🛡️ stop loss
Technical Indicators Analysis
📊 Volume Analysis:
Pattern: Increasing volume on downside candles, confirming distribution
Bearish volume profile with spikes on red candles, low volume on minor recoveries—classic topping sign
📈 MACD Analysis:
Signal: Bearish crossover and diverging lower
MACD line crossed below signal with histogram expanding negative, momentum fully bearish
Applied TradingView Drawing Utilities
This chart analysis utilizes the following professional drawing tools:
Disclaimer: This technical analysis by Owen Sutherland is for educational purposes only and should not be considered as financial advice.
Trading involves risk, and you should always do your own research before making investment decisions.
Past performance does not guarantee future results. The analysis reflects the author’s personal methodology and risk tolerance (medium).
Beginners often FOMO at peaks and freeze at troughs. Flip that script. Use this dip for safe crypto purchase during dip by sticking to rules. Simulate trades on paper first – build conviction without risk. My six years prove: emotion kills, systems win.
Zoom out: despite $1.6 billion ETF pain, Bitcoin’s ecosystem grows. ETF access draws institutions back eventually. Forbes’ $1 trillion wipeout talk? Overhyped noise. Real alpha lies in flow reversals and policy digestion.
Execute these steps, manage risk religiously, and this $78,771 base becomes your launchpad. Volatility rewards the prepared. Stay nimble, trade smart, and ride the next leg up. React fast, manage risk – that’s the edge in 2026’s wild markets.