
Bitcoin’s crashing to $67,170 right now in February 2026, down from its $126,210.50 peak last October. That’s a brutal 47% drop, fueled by regulatory jitters and a risk-off market. But here’s the pragmatic play: whales are loading up. Michael Saylor’s Strategy just scooped 1,142 BTC at an average $78,815, pushing their stash to 714,644 coins despite unrealized losses. SkyBridge’s Anthony Scaramucci, with 70% of his wealth in BTC plays, is buying this dip hard. Follow their lead, react fast, manage risk, and turn volatility into your edge.

Why Whales Like Saylor and Scaramucci Are Doubling Down Now
Dips like this $67,170 level scream opportunity if you’re tracking smart money. Strategy’s not flinching; they bought another 855 BTC the prior week at $87,974 average. Saylor’s on CNBC preaching they’ll buy every quarter forever, calling volatility a feature, not a bug. No selling, even with their $50 billion and position underwater. Scaramucci echoes this, steady accumulation below $73,000, tying it to long-term conviction.
Binance’s CZ even chimed in, backing the HODL amid unrealized losses. These aren’t retail panic sellers; they’re institutions positioning for the rebound. BTC’s 24-hour low hit $65,839 today, but whales see $67,170 as cheap. Their strategy? Dollar-cost average through fear, leveraging equity and debt for BTC bets. If you’re serious about buy bitcoin dip 2026, mirror this: ignore noise, stack sats.
Decode Saylor’s Bitcoin Strategy for Your 2026 Playbook
Michael Saylor’s masterclass isn’t gambling; it’s engineered accumulation. Strategy’s latest $90 million buy between February 2-8 at $78,815 average proves it. Total cost basis? $54.35 billion for 714,644 BTC. Current price $67,170 puts them underwater, yet Saylor shrugs: “We are not going to be sellers. ” His thesis: Bitcoin’s the apex property, infinite upside against fiat decay.
Key moves to steal: Use convertible debt and equity raises to fund buys without liquidating. Time purchases during fear spikes, like now at $67,170. Saylor integrates BTC into corporate treasury, proposing it for traditional finance. SkyBridge follows suit, Scaramucci advocating steady buys as BTC dips below key supports. Opinion: This isn’t blind faith; it’s price action mastery. Volatility lets you buy low, like their $69,000-ish recent grabs.
For beginners eyeing michael saylor bitcoin strategy, start small but consistent. Track on-chain whale alerts for confirmation. Strategy’s not alone; ETF inflows could rebound, per whispers. But act now, before the crowd piles in.
Bitcoin (BTC) Price Prediction 2027-2032
Post-2026 Dip Recovery Projections: Following Whales, Saylor’s Strategy, and SkyBridge Accumulation
| Year | Minimum Price (Bear) | Average Price (Base) | Maximum Price (Bull) | YoY % Change (Base from Prior Year) |
|---|---|---|---|---|
| 2027 | $80,000 | $110,000 | $150,000 | +22% |
| 2028 | $120,000 | $180,000 | $280,000 | +64% |
| 2029 | $160,000 | $250,000 | $380,000 | +39% |
| 2030 | $220,000 | $350,000 | $520,000 | +40% |
| 2031 | $300,000 | $450,000 | $650,000 | +29% |
| 2032 | $380,000 | $600,000 | $850,000 | +33% |
Price Prediction Summary
Bitcoin is projected to recover robustly from the 2026 dip around $67,000, with average prices climbing from $110,000 in 2027 to $600,000 by 2032. This outlook incorporates institutional accumulation, halving cycles, regulatory progress, and adoption growth, balancing bearish regulatory risks with bullish supply dynamics.
Key Factors Affecting Bitcoin Price
- Continued institutional buying by MicroStrategy (Saylor), SkyBridge Capital, and whales during dips
- 2028 Bitcoin halving reducing new supply and historically sparking bull runs
- Improving regulatory clarity reducing uncertainty and enabling broader adoption
- Scalability enhancements via Lightning Network and layer-2 solutions boosting utility
- Macroeconomic shifts favoring risk assets amid potential rate cuts and inflation hedging
- Persistent BTC dominance over altcoins amid market cycles
- Global adoption trends including nation-state reserves and ETF inflows
Disclaimer: Cryptocurrency price predictions are speculative and based on current market analysis.
Actual prices may vary significantly due to market volatility, regulatory changes, and other factors.
Always do your own research before making investment decisions.
First Steps: Secure Your Setup to Buy Bitcoin at $67,170
Don’t chase FOMO; build infrastructure first. Step 1: Pick a rock-solid exchange. Binance, Coinbase, or Kraken for US folks. Verify KYC fast, fund via bank wire or stablecoin for speed. Enable 2FA, hardware wallet link from day one. Risk management: Never invest more than 5-10% portfolio here.
Step 2: Time your entry like whales. Watch for $67,170 support holding after today’s $65,839 low. Use limit orders below current $67,170 to snag better fills. Dollar-cost average: Split buys over 3-5 days, avoiding all-in hero trades. Saylor’s playbook scales this corporate-style, but retail wins with discipline.
Pro tip: Monitor bitcoin whales accumulation 2026 via Whale Alert. Recent Strategy buys signal green light. Scaramucci’s dip-buying? Pure conviction at these levels. Next: Dive into execution tactics mirroring SkyBridge’s steady grind.
Execution starts with precision. SkyBridge’s Scaramucci isn’t splashing cash blindly; he’s grinding steady buys below $73,000, now amplified at $67,170. His 70% BTC exposure thrives on dips like today’s 24-hour range from $65,839 to $68,428. Mirror that: scale in, track whale wallets, and position for the rebound. ETF inflows could rebound soon, fueling the next leg up. But first, nail the mechanics.
SkyBridge Scaramucci’s Dip Play: Steady Accumulation at $67,170
SkyBridge Capital under Scaramucci turns crashes into portfolios. He’s vocal: buying the latest dip hard, endorsing Saylor’s HODL amid regulatory noise. With BTC at $67,170, down 47% from $126,210.50, Scaramucci sees apex property value. His tactic? Layer buys during fear, diversify via BTC trusts and direct holds. No panic, just conviction. For skybridge scaramucci buy bitcoin, it’s about patience: accumulate 1-2% weekly, rebalance quarterly.
Whales like Strategy provide on-chain proof. Their 1,142 BTC grab at $78,815 average ignores paper losses over $5 billion. Scaramucci piles on, claiming 70% wealth in crypto bets. Retail twist: Use this intel for spot buys. Watch for cluster buys below $67,170; that’s your signal. Combine with Saylor’s debt-fueled scaling for a hybrid approach that crushes volatility.
Bitcoin Technical Analysis Chart
Analysis by Owen Sutherland | Symbol: BINANCE:BTCUSDT | Interval: 1D | Drawings: 8
Technical Analysis Summary
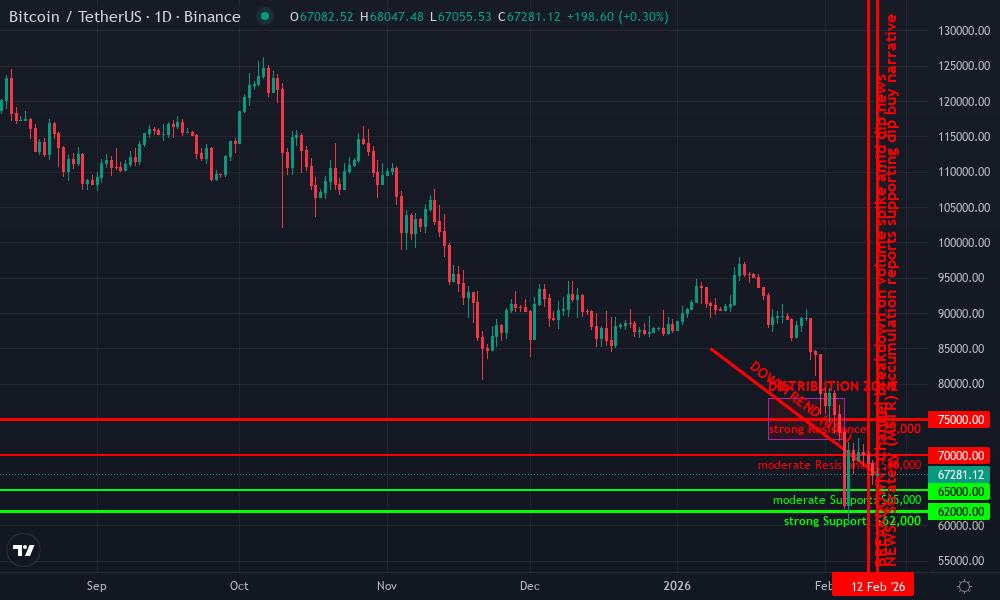
As Owen Sutherland, begin by drawing a prominent downtrend line connecting the swing high in early January 2026 around $85,000 on 2026-01-08 to the recent high near $72,000 on 2026-02-05, extending to current levels near $67,170, using the ‘trend_line’ tool in red with medium thickness to highlight the dominant bearish channel. Add horizontal lines for key support at $65,800 (weak, recent low), $65,000 (moderate), and $62,000 (strong psychological); resistances at $68,400 (weak), $70,000 (moderate), and $75,000 (strong) in blue. Mark entry zone for longs around $66,500-$67,200 with a green rectangle or order_line for long_position. Place profit targets at $72,000 and stop loss at $65,000 using order_line. Use fib_retracement from recent low $65,839 (2026-02-11) to high $68,428 (2026-02-11) for short-term pullback levels. Add callouts for volume spikes on breakdowns and MACD bearish crossover. Draw a consolidation rectangle from 2026-02-08 to 2026-02-12 between $66,000-$68,000. Vertical line for recent breakdown on 2026-02-10. Text box with ‘Patience at support’ near current price. Arrow_mark_up for potential bounce.
Risk Assessment: medium
Analysis: High volatility from regulatory overhang balanced by whale buying and technical exhaustion; medium risk tolerance suits swing plays here
Owen Sutherland’s Recommendation: Scale in longs from $66,500 support with 1-2% risk per trade, targeting $72,000. Patience and precision—wait for volume confirmation.
Key Support & Resistance Levels
📈 Support Levels:
-
$65,800 – Recent 24h low, initial bounce point
weak -
$65,000 – Psychological round number with prior tests
moderate -
$62,000 – Deeper correction target, aligns with 0.618 fib from Oct peak
strong
📉 Resistance Levels:
-
$68,400 – 24h high, immediate overhead
weak -
$70,000 – Recent swing low turned resistance
moderate -
$75,000 – Strong prior support now resistance in downtrend
strong
Trading Zones (medium risk tolerance)
🎯 Entry Zones:
-
$66,500 – Bounce from support cluster amid whale accumulation signals
medium risk
🚪 Exit Zones:
-
$72,000 – Measured move target from recent range expansion
💰 profit target -
$65,000 – Invalidation below key support
🛡️ stop loss
Technical Indicators Analysis
📊 Volume Analysis:
Pattern: Climax selling volumes on breakdowns, drying up recently
High volume confirms downtrend but latest bars show divergence suggesting exhaustion
📈 MACD Analysis:
Signal: Bearish histogram but potential bullish divergence
MACD line below signal with narrowing histogram, watch for crossover
Applied TradingView Drawing Utilities
This chart analysis utilizes the following professional drawing tools:
Disclaimer: This technical analysis by Owen Sutherland is for educational purposes only and should not be considered as financial advice.
Trading involves risk, and you should always do your own research before making investment decisions.
Past performance does not guarantee future results. The analysis reflects the author’s personal methodology and risk tolerance (medium).
Action Time: Step-by-Step Guide to Buy Bitcoin Dip Following Whales
Enough theory; let’s execute. This beginner guide buy crypto crash distills Saylor, Scaramucci, and whale moves into retail bites. Current price $67,170 screams entry if support holds post-$65,839 low. Risk first: Set stop-losses at 5-10% below, never more than 5% portfolio. Fund with fiat or USDT for instant action.
Buy BTC Like Saylor & Whales: 7 Steps to Crush the 2026 Dip


Post-buy: Secure in Ledger or Trezor. Track holdings via Blockfolio. Revisit weekly; if whales like Strategy add more, double down scaled. Saylor’s forever buys mean long horizon, but day-trade edges exist on 4-hour charts showing $67,170 bounce potential.
Risks and Edges: Managing Volatility Like a Pro
Dips to $67,170 pack punches. Regulations loom, equities retreat, unrealized losses tempt sells. Counter: Saylor’s thesis treats volatility as fuel. Strategy holds 714,644 BTC at $54.35 billion cost; they’re down but buying. Scaramucci’s steady grind weathers it. Your edge? On-chain data trumps headlines. Tools like Glassnode flag bitcoin whales accumulation 2026, confirming green.
Pragmatic hedges: 50% spot BTC, 30% BTC ETFs for liquidity, 20% stables. Exit rules: Trail stops above $75,000 resistance. Opinion: This setup beats waiting. Whales aren’t waiting; Strategy’s quarterly ritual rolls on. ETF inflows rebound whispers add tailwinds. At $67,170, fear peaks opportunity.
Stack sats now, react to whale flows, scale like SkyBridge. $67,170 won’t last; Saylor’s conviction and Scaramucci’s grit prove it. Build your position, manage tight, and ride the recovery. Volatility rewards the prepared.